What is Process Hollowing?
Process hollowing occurs when a malware launches a process in a suspended state and then deallocates the process memory which contains the original program’s code (Hollow process memory out), and replaces it with the malicious content/code.
How does Process Hollowing process gets accomplished?
- Malicious process creates a legitimate process in a suspended state using CreateProcess() function.
- The legitimate process memory gets hollowed out to have the malicious code replaces the original code. This is performed by calling NtUnmapViewOfSection or ZwUnmapViewofSection functions.
- Allocated a new memory in the original process using VirtualAllocEx()
- The allocated memory gets written into with the malicious code using WriteProcessMemory()
- Process ends the suspended state by invoking ResumeThread()
12th Challenge
Let’s check 6th advanced challenge (Frog Find) in (incident-response-challenge.com) website and try to solve it.
The challenge stresses that there is “frog” hidden in a process.
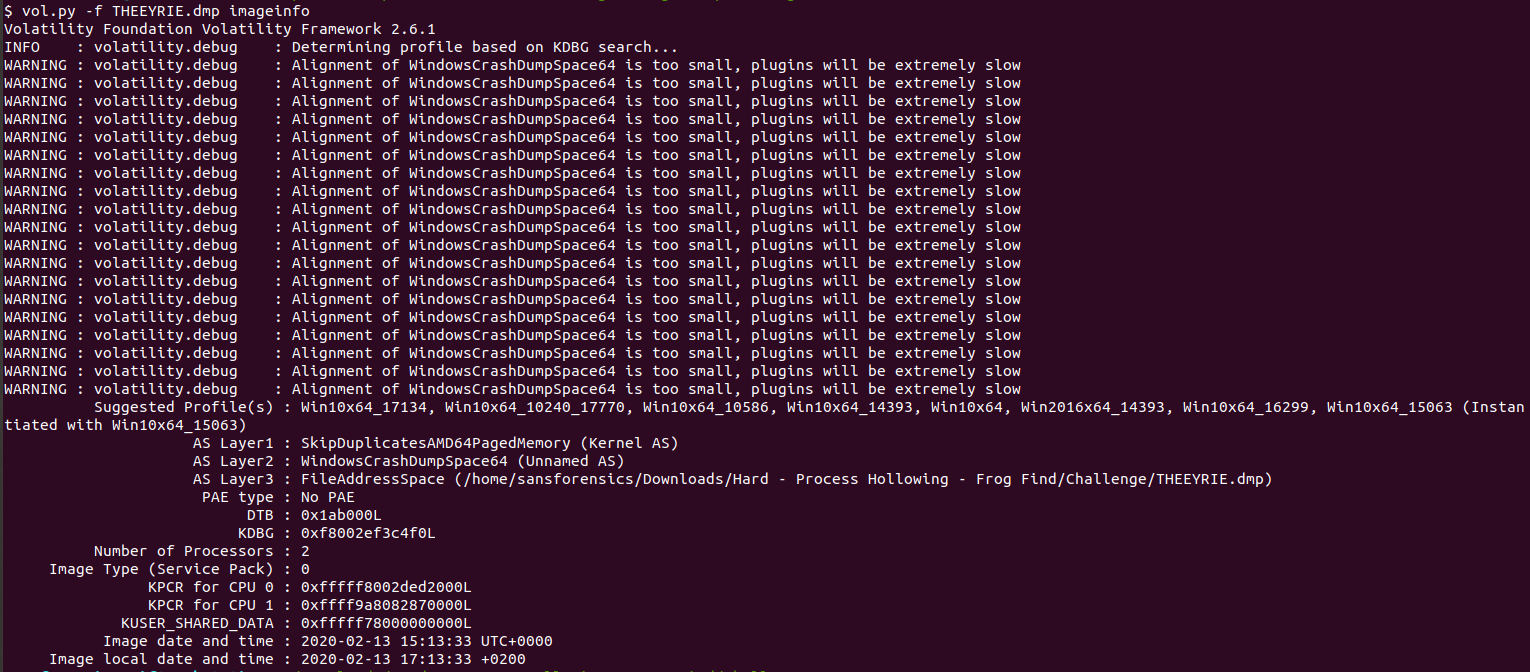
First thing we will do is to find memory image profile using volatility imageinfo plugin.
vol.py -f THEEYRIE.dmp imageinfo
How to identify process hollowing from a memory image?
- When an application gets executed, memory regions/pages are assigned to this executable in memory so process content has defined regions in the memory to get executed.
- Every process has what is called Executive Process Structure (_EPROCESS). This EPROCESS contains fields which provide information about the process and points to other structures such as Virtual Address Descriptor (VAD).
- One of the EPROCESS fields is something called ActiveProcessLinks which is part of a complete doubly linked list structures that circulates all the existing processes in memory.
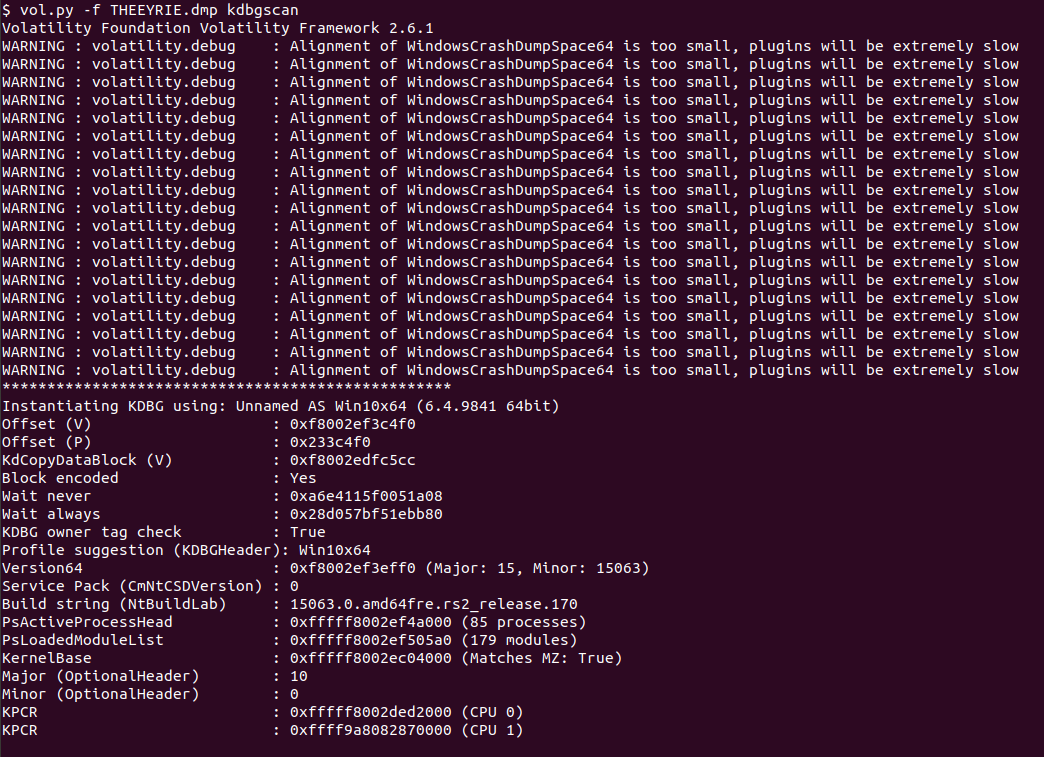
- When we run imageinfo or kdbgscan plugins, we identify what’s called PsActiveProcessHead.
- PsActiveProcessHead points to the doubly linked list ActiveProcessLink of the process “System”. Now, traversing other processes is achievable as this is doubly linked list (In doubly linked list there are two links to the next and to the previous nodes in every node)
- Remember, VAD structure is one of the structures that EPROCESS points to.
What is VAD?
- VAD trackes the memory pages that are allocated to a process.
- Volatility malfind plugin searches for VAD entries that represent memory pages which are dynamically allocated during runtime using API calls such as VirtualAllocEx as what occurs in process hollowing.
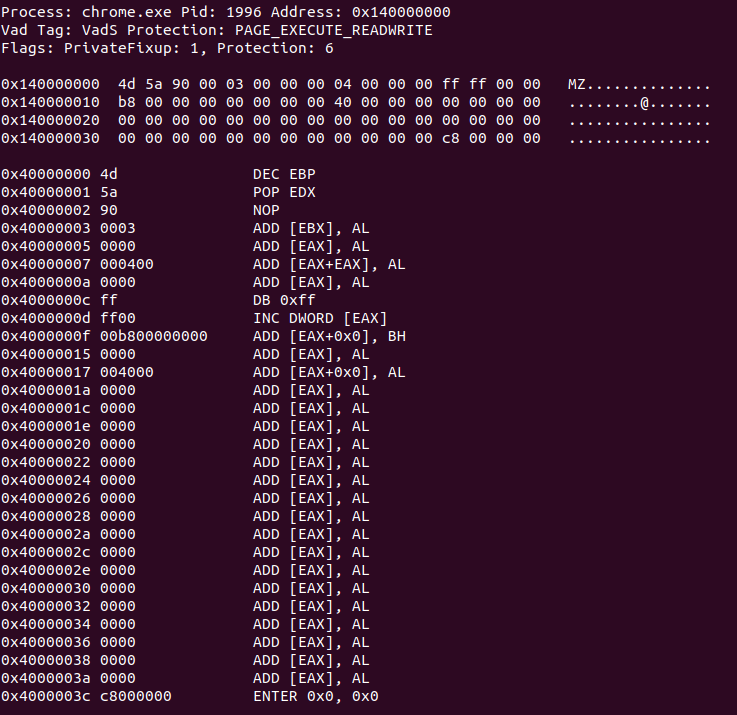
- Not only that, it looks if these memory pages contain PAGE_EXECUTE_READWRITE permission and looks if instructions inside it represent PE header (Windows executable header)
Execute malfind against the memory using one of the suggested profiles from imageinfo
vol.py -f THEEYRIE.dmp --profile=Win10x64_17134 malfind
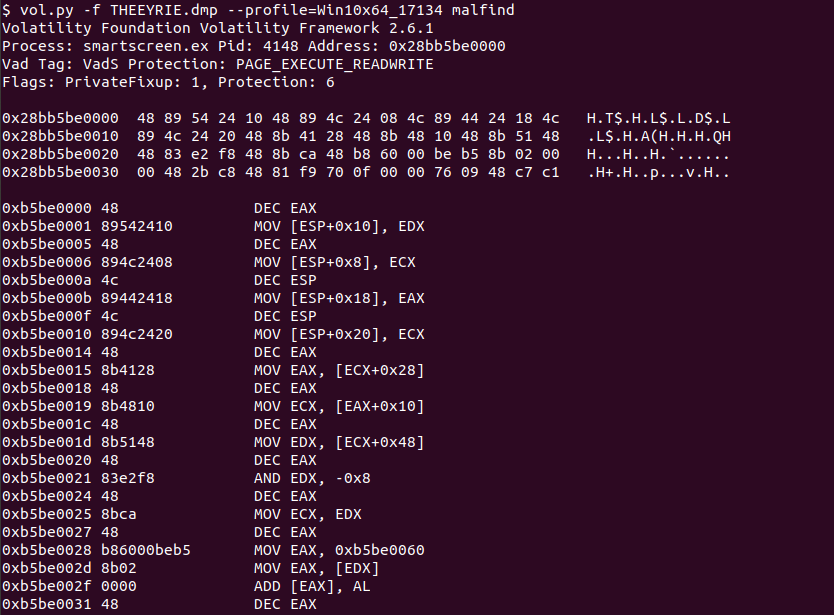
The only candidate which contains an executable (MZ header) is this process chrome.exe with process ID 1996
Dump chrome.exe process memory (memdump)
We can identify if there is malicious content by dumping the whole process memory pages that are assigned to this suspicious process using memdump plugin
vol.py -f THEEYRIE.dmp --profile=Win10x64_17134 memdump -p1996 -D chromeDump/
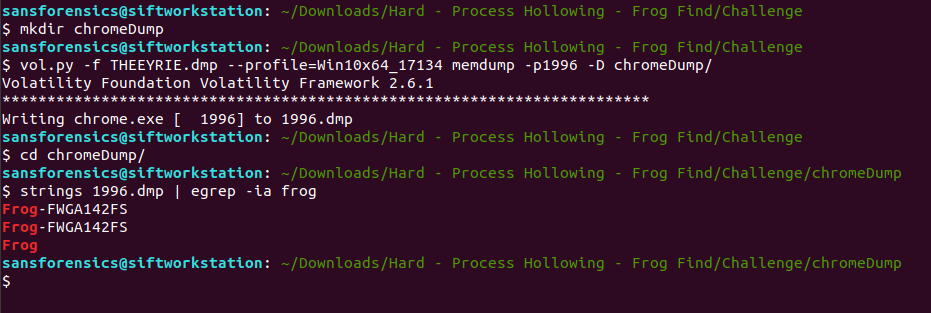
Answer to the challenge
Frog-FWGA142FS
Alternative Approach
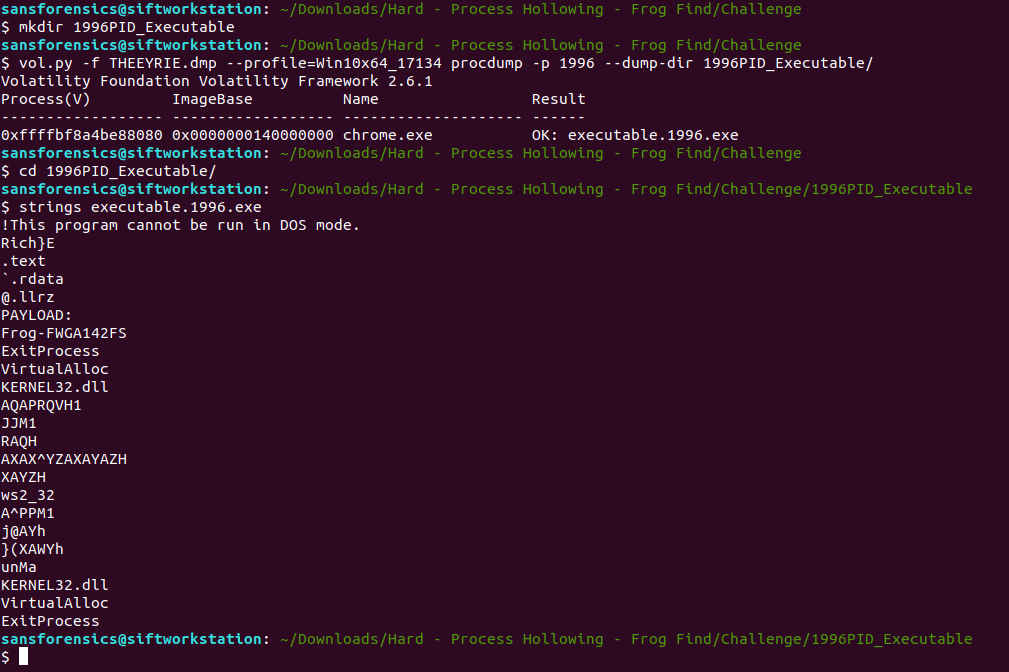
Dump chrome.exe process executable (procdump)
Alternative option is to dump the malicious process executable image as well and perform the same check
vol.py -f THEEYRIE.dmp --profile=Win10x64_17134 procdump -p 1996 --dump-dir 1996PID_Executable/
References
- The challenge used in this post belongs to incident-response-challenge.com
- https://imphash.medium.com/windows-process-internals-a-few-concepts-to-know-before-jumping-on-memory-forensics-823d72d4d7b8